Equity markets rise is defying concerns
S&P 500 keeps going up, while Europe saw some weakness due to politics risks
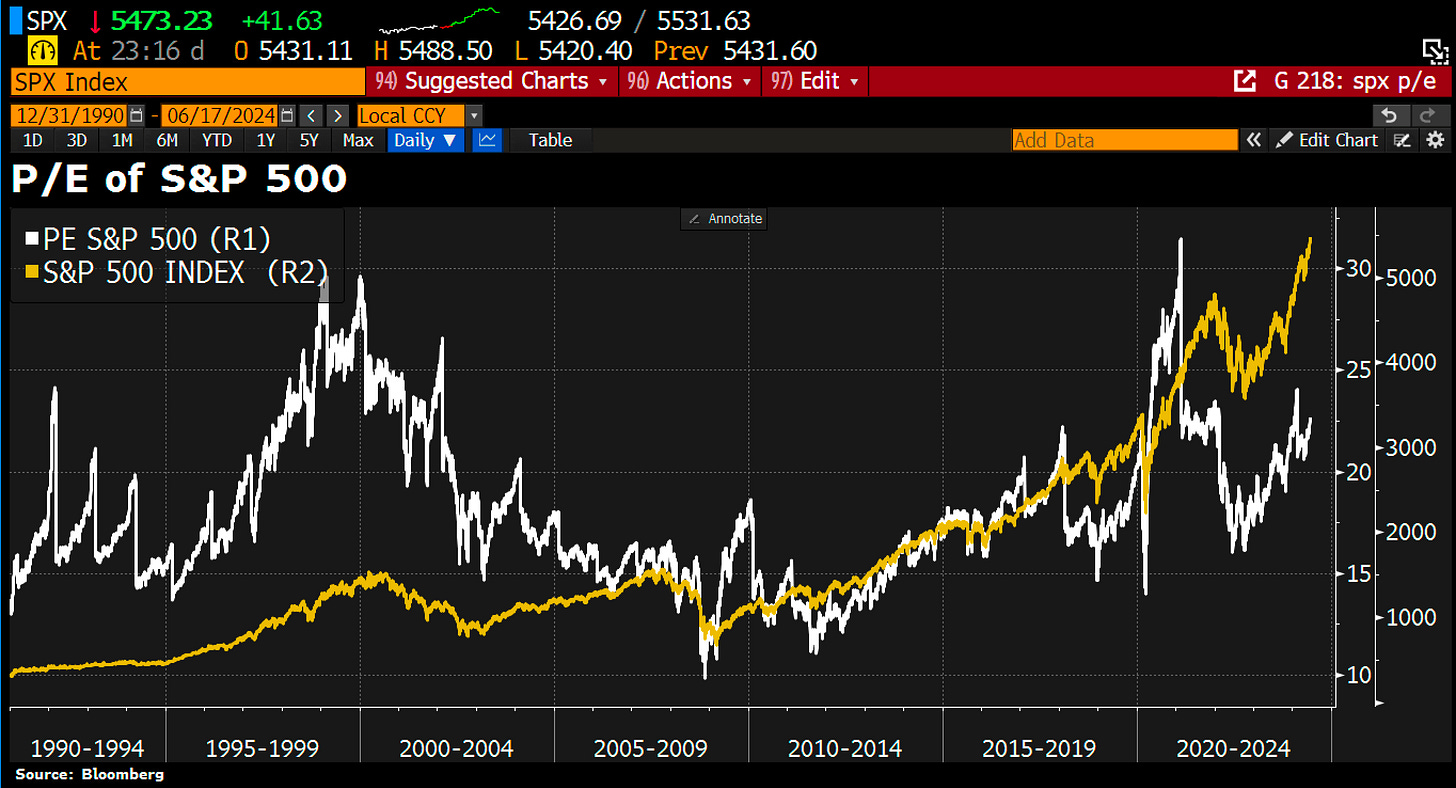
S&P 500 hit its 30th record this year, defying concerns about high valuations & narrow breadth that could make the market more vulnerable to surprises.
NASDAQ has not been this overbought since early 2018, but as we all know, overbought can stay overbought for long periods of time. And it was also another new high print for the NDX vs NDX equal weight ratio. NDX is up ~7.5% over the last month, under the hood, only ~50% of the index is even up over this 1-month stretch and nearly 70% of the gains (e.g. ~5pts of the ~7.5pts) can be attributed to just 3 stocks (NVDA, AVGO, AAPL).
Spot up, volatility up in NASDAQ is making a comeback. The crowd is busy chasing upside exposure, as this remains the number one force. These are the things you pay close attention to, especially with markets in very overbought territory.
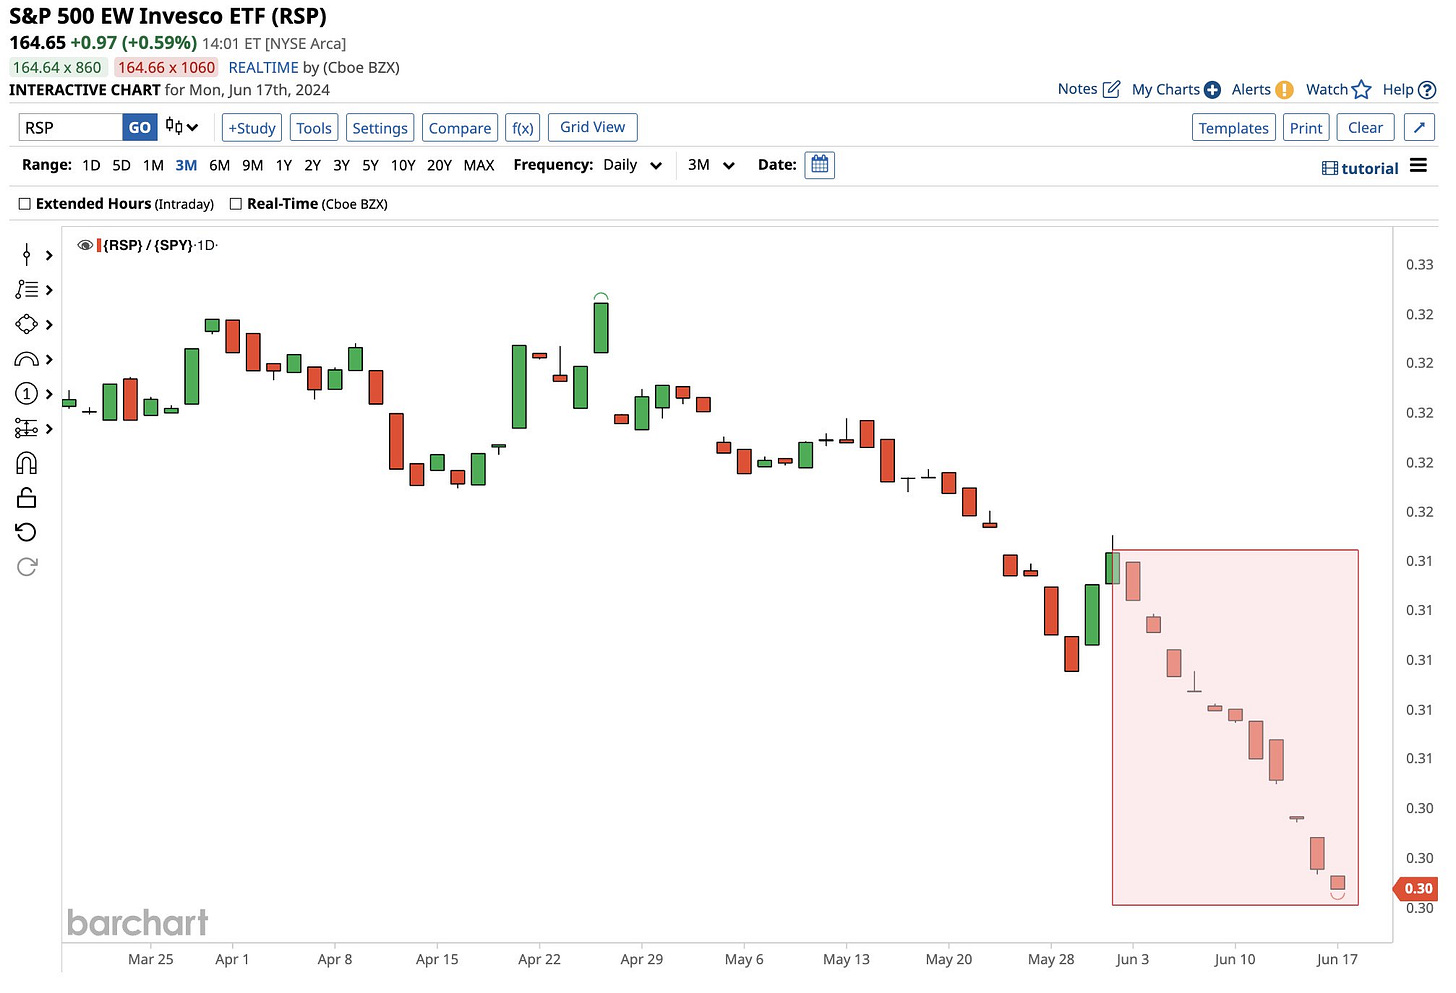
Is a breadth rebound ahead of us? This might not be the worst time to initiate a breadth improvement bet. The equal-weight indices are very extended vs Market-cap weighted ones. It's on track for its 11th straight red day and 18 of the last 20 days. Equal Weighted S&P 500 (RSP) still falling off a cliff against the Market Weighted S&P 500 (SPX).
An impressive market concentration
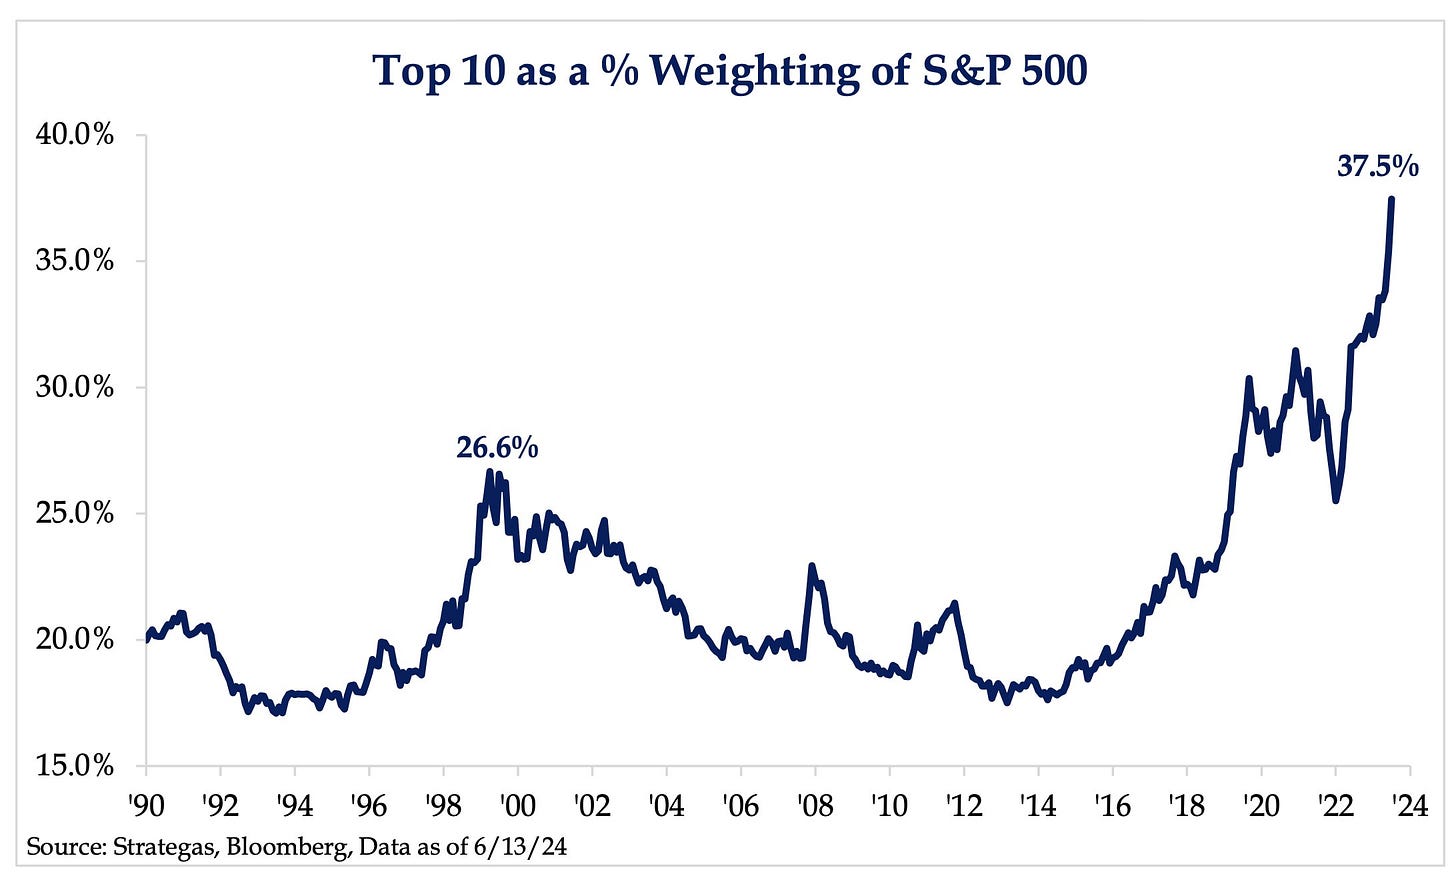
The 10 largest stocks in the S&P 500 now account for 37% of the market’s total capitalization, far exceeding the prior peak of 26% in 1999. But the top 10 are the top 10 for a reason, SRP says: 10 largest stocks today also account for 31% of S&P’s total net income, with an average trailing profit margin of 26% and average trailing annual earnings growth of 264%.
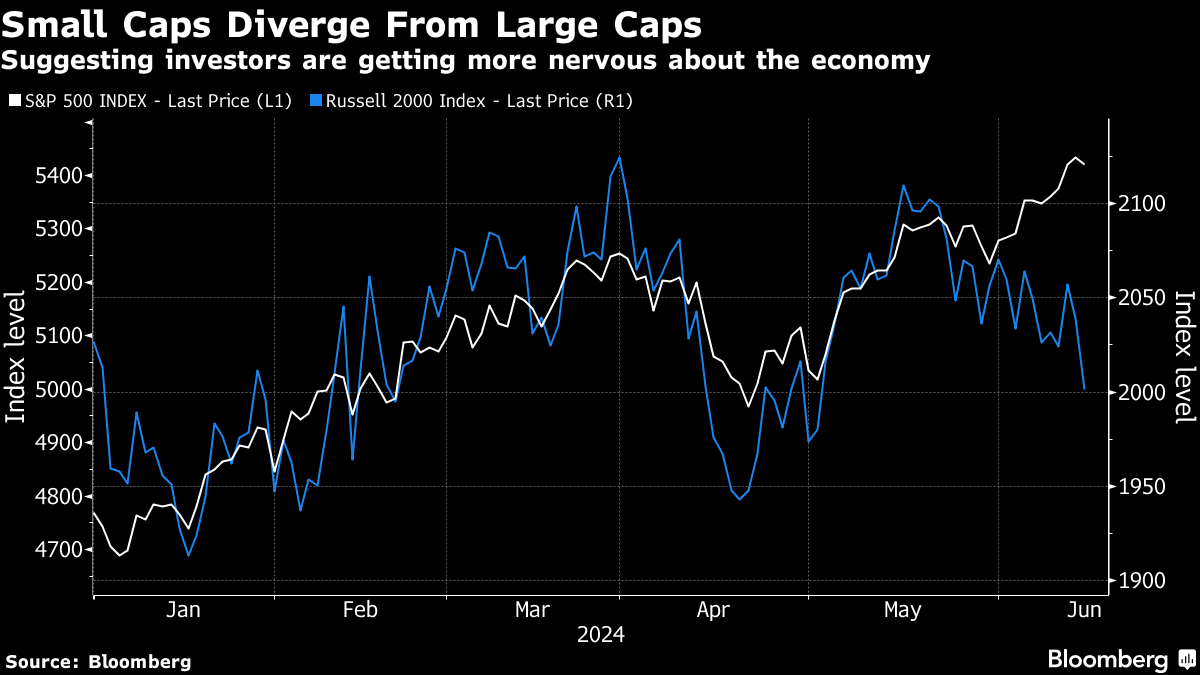
The underperformance of US small caps casts a cloud over the S&P 500’s record run, according to MLIV. The softness in recent data, particularly in the labour market, looks to be making small-cap investors more nervous than those buying large caps dominated by tech.
Apollo warns about this extreme concentration in returns in the S&P 500. 35% of the increase in the S&P 500’s market cap since the beginning of the year has come from one stock. Such a high concentration implies that if NVIDIA continues to rise, then things are fine. But if it starts to decline, then the S&P 500 will be hit hard. The bottom line is that the extreme concentration of returns in the S&P 500 makes investors more vulnerable to single headlines impacting the one stock driving index returns.
Is the equity market too expensive?
S&P Top 100 companies valuation: of the top 100 companies in the United States, 23 of them trade for at least 50x earnings. That is more than the total number of companies who trade for a P/E below 20. Just two of the hundred companies trade for a single-digit multiple of reported earnings.
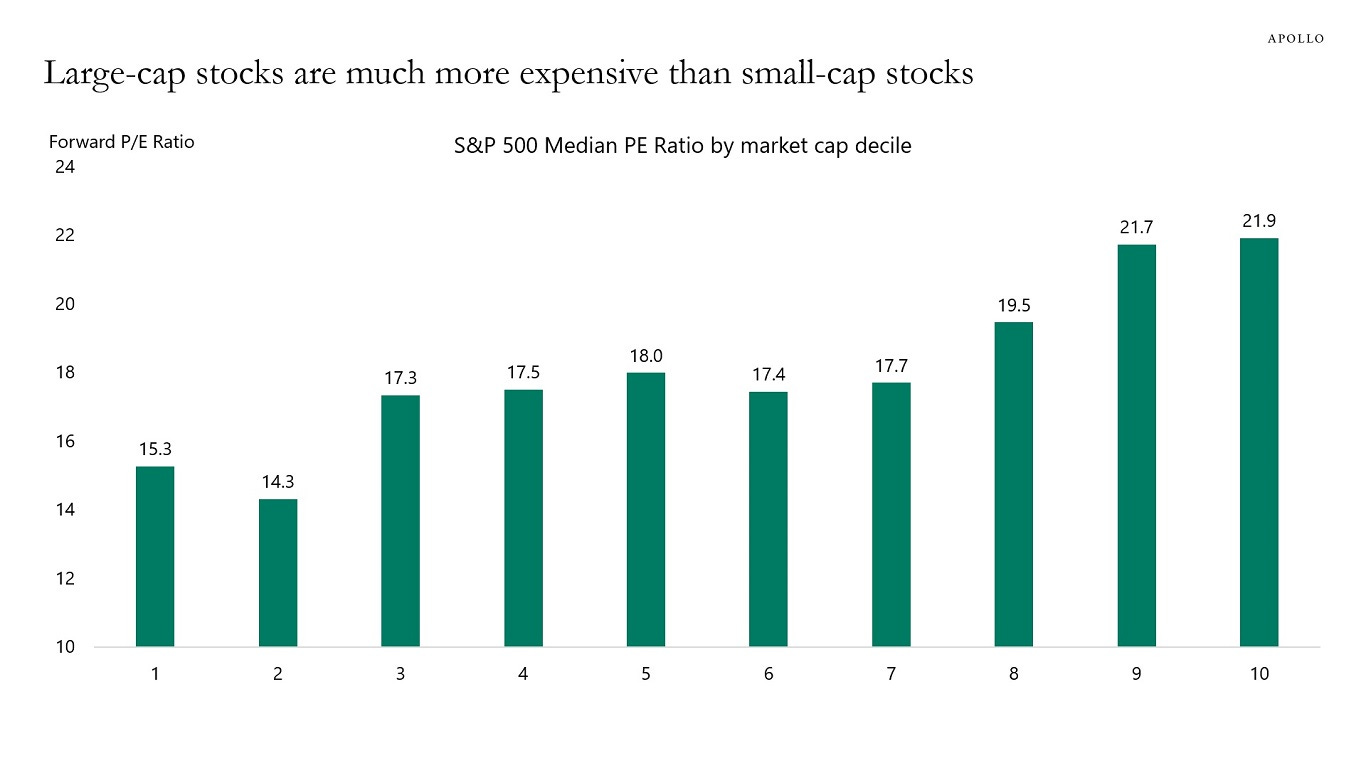
Apollo also sees a big difference between small-cap and large cap valuations in the S&P 500. Looking at P/E ratios for companies in the S&P 500 ranked by market cap shows that large-cap companies are much more expensive than small-cap companies. Why are P/E ratios low for small-cap companies and high for large-cap companies? Because Fed hikes and higher costs of capital are weighing on highly leveraged small-cap companies with low coverage ratios. And the AI story has boosted valuations of mega-cap names. With the Fed keeping interest rates higher for longer, and the AI narrative pushing valuations and index concentration to extreme levels, the downside risks to equities are growing.
Mega-cap tech EPS growth premium is expected to narrow – but still crush the rest of the market all the way to 2026. FactSet
Magnificent 7 stocks have officially exceeded US$ 15tn in combined market cap for the 1st time ever. The group's combined market cap now equals over 50% of US GDP. In just 2 months the Magnificent 7's value has surged by a whopping US$ 2tn. The Magnificent 7 stocks have rallied by over 60% over the last 12 months compared to only a 20% gain in the other 493 S&P 500 stocks. Combined they reflect over a record 30% of the entire S&P 500.
Street updated views on the market
US Equities – Goldman Sachs raises the S&P 500 year-end target to 5600.
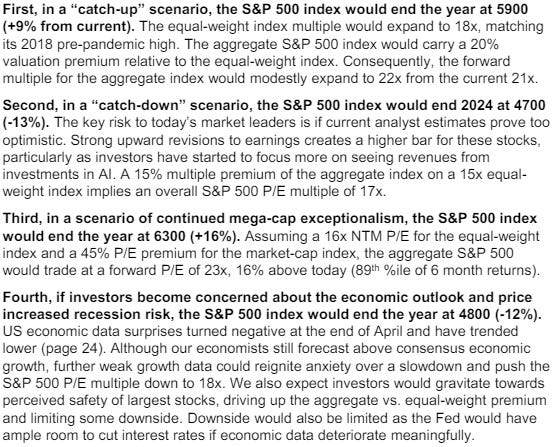
“We raise our S&P 500 year-end target from 5200 to 5600 (+3% from current level) driven by milder-than-average negative earnings revisions and a higher fair value P/E multiple (from 19.5x to 20.4x). We expect roughly unchanged real yields by year-end and strong earnings growth will support a 15x P/E for the equal-weight S&P 500 and a 36% premium multiple for the market-cap index. Looking ahead, our valuation model suggests the S&P 500 P/E will be 20.4x by year-end, 3% below the current multiple of 21.1x. Strong consensus 2025 earnings growth and a roughly unchanged real yield imply a year-end 2024 fair value P/E multiple of 15x for the equal-weight S&P 500. As EPS growth expectations for the mega-caps gradually converge towards the typical stock, the modelled premium carried by the aggregate index should equal 36% by year-end”.
They also discuss four alternative valuation scenarios: “catch-up” (5900), “catch-down” (4700), further mega-cap exceptionalism (6300), and recession risk (4800)”:
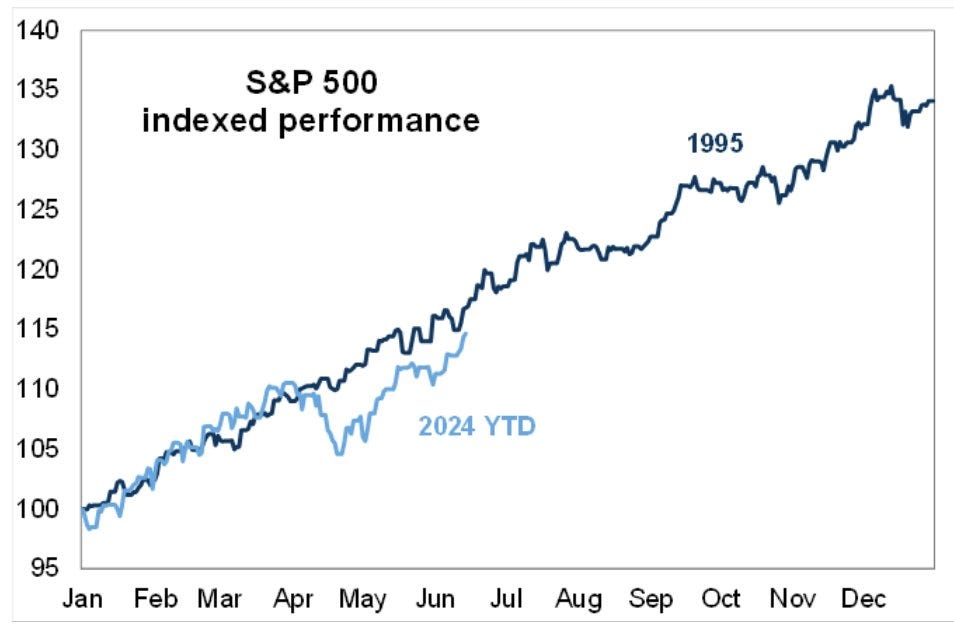
"We think this year has 1995 flavour to it. 1995 was last soft landing. Fed cut from 600bps to 525bps. SPX made 77 ATHs [...] and that was just the appetizer with epic run through 1999. YTD SPX already has 29 ATH closes and best start to an election year ever".
US Equities – Evercore: raises its year-end 2024 S&P 500 PT to 6,000, up from the previous estimate of 4750 points. 7,000 is possible by end-2025. Estimate for the index’s per-share earnings in 2024 and 2025 to US$ 238 and US$ 251, respectively (imply a 8% and 5% profit growth) says the US$ 238 EPS pushed price to earnings to 25 (trailing basis), elevated by historical standards but short of the 28 level during the dot-com peak. “The pandemic changed everything. Record stimulus, elevated cash balances and low leverage support the consumer. Then came AI. Today, GenAI’s potential in every job and sector is inflecting. The backdrop of slowing inflation, a Fed intent on cutting rates and growth support Goldilocks.”
JPMorgan Kolanovic: “Our cautious stance has been based on our view that there is no re-rating upside, and that any upside had to therefore come from earnings growth, which we see being insufficient to take on equity risk even under best case scenario assumptions. For equities to avoid a 20%+ correction, you have to believe that tech will become a much more meaningful driver of growth for the broad economy in short order. While we believe tech will continue to be the key driver of economic growth for years to come, we don’t think its impact on corporate P&Ls across the board will be that profound so suddenly, and so we remain cautious here, expecting economic growth to weaken, equities to correct, and investors to find a better entry point.”
And what about Europe? It’s all about France & politics
European stocks have underperformed the S&P 500 by 3% last week. This is the largest weakness since March 2023 banking turmoil.
Citi downgrades Europe stocks on political turmoil, upgrades US after Stoxx600 underperformed most since the 2023 banking turmoil. Strategists cite political risks as they lower Europe view. Bloomberg
France – Morgan Stanley take: Chief EU Economist Jens Eisenschmidt looks at four potential scenarios after the French elections.
First, Macron’s Renaissance manages to build a coalition and secures a majority. Jens argues that the ongoing political difficulties might reduce the willingness of the majority to reduce the public deficit, increasing the likelihood that the 2025 deficit ends closer to MS forecast of 4.8% of GDP vs the government’s target of 4.1%.
Next, the announced union of parties from the left obtaining a majority could mean an undoing of recent pensions reforms and no engagement in fiscal consolidation.
Further, should the Rassemblement National (RN) obtain a majority, the key focus points would be Health Care (€ 20bn emergency plan, including higher wages and jobs creation), Housing (100,000 units of social housing each year) and Energy (less support to renewables and a focus on nuclear power).
Lastly, no party winning a majority would mean a scenario of very high uncertainty and could resemble the outcome of the 2022 legislative elections.
France – Deutsche Bank take:
The Franco-German 10yr bond spread rose +28.6bps over the week (and +6.9bps on Friday). This brings it to its highest level since November 2012, and its largest weekly increase since late 2011 during the Euro crisis, and during German reunification in August 1990. The spread is now +76.7bps with Deutsche Bank rates strategists targeting +90bps. They think +90-100bps would be the equivalent to the 2017 Presidential election peak of +80bps when adjusting for today's French fundamentals. However, with 10yr German bund yields falling -25.9bps (and -11.0bps on Friday), the 10yr OAT yield rose by a modest +2.7bps (-4.1bps on Friday). In equity risk, the CAC 40 fell -6.23% last week (-2.66% on Friday), its largest weekly move down since March 2022 and apart from another big differential in the early Covid period you’d have to go back to the aftermath of 9/11 in 2001 to see such extremes. The euro also weakened off the back of the growing French election risk, falling -0.91% (and -0.30% on Friday).


