Fed's cautious approach and a market wrap-up
Powell's policy updates, inflation concerns, and market reactions
Fed path: the timing of cuts
On Tuesday evening (9th July), Powell gave a brief speech, updating Fed’s focus. Main highlights:
Powell signalled that the Fed is in no rush to cut interest rates.
Powell said policymakers remain attentive to the risks that inflation poses and don’t want to ease up too soon and too much.
Powell added that easing too little too late could ‘unduly weaken the economy’.
Powell noted again that ‘more good data’ is needed to boost confidence that inflation is moving sustainably toward 2%.
Powell mentioned that the labour market is still strong, and the economy is expanding at a solid pace.
Key Takeaway: Powell’s comments reinforce the view that the Fed is not yet ready to start easing monetary policy and that a September rate cut might be too soon.
WSJ's Timiraos commented that "Powell inches the Fed closer to cutting rate" and suggested that Powell made a subtle but important shift in his assessment of the risks that moved the Fed closer to lowering interest rates when he said that the trade-offs between bringing inflation down and maintaining a solid labour market are changing.
With CPI coming soon, BofA says they believe that it is prudent to hedge, especially with the 2Q earnings season starting this Friday (first page report).
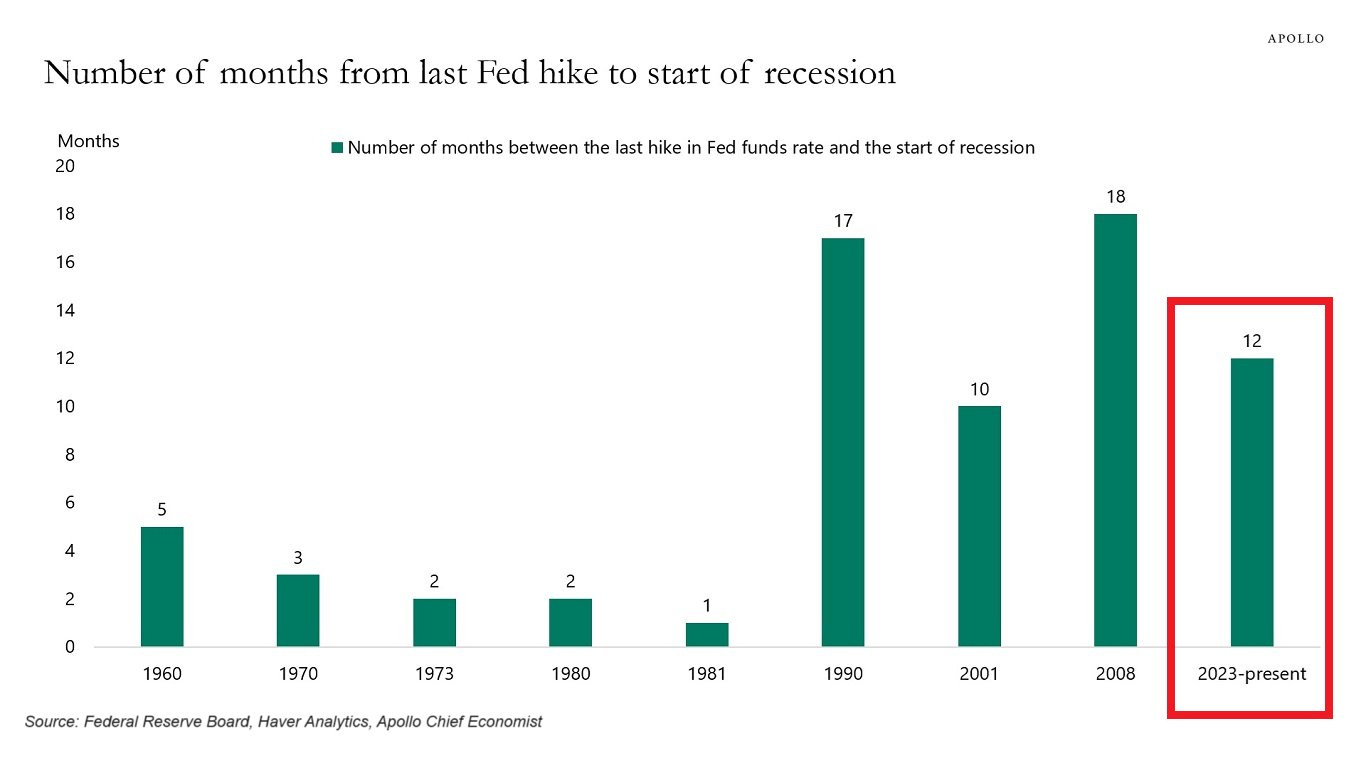
Moreover, a curious stat by Apollo: economic recession in the US usually comes within 18 months from the last Fed rate hike. It has been now 12 months since the last Fed hike in July 2023. If history is any guide, the US economy should fall into a recession before the end of 2024 or is already in.
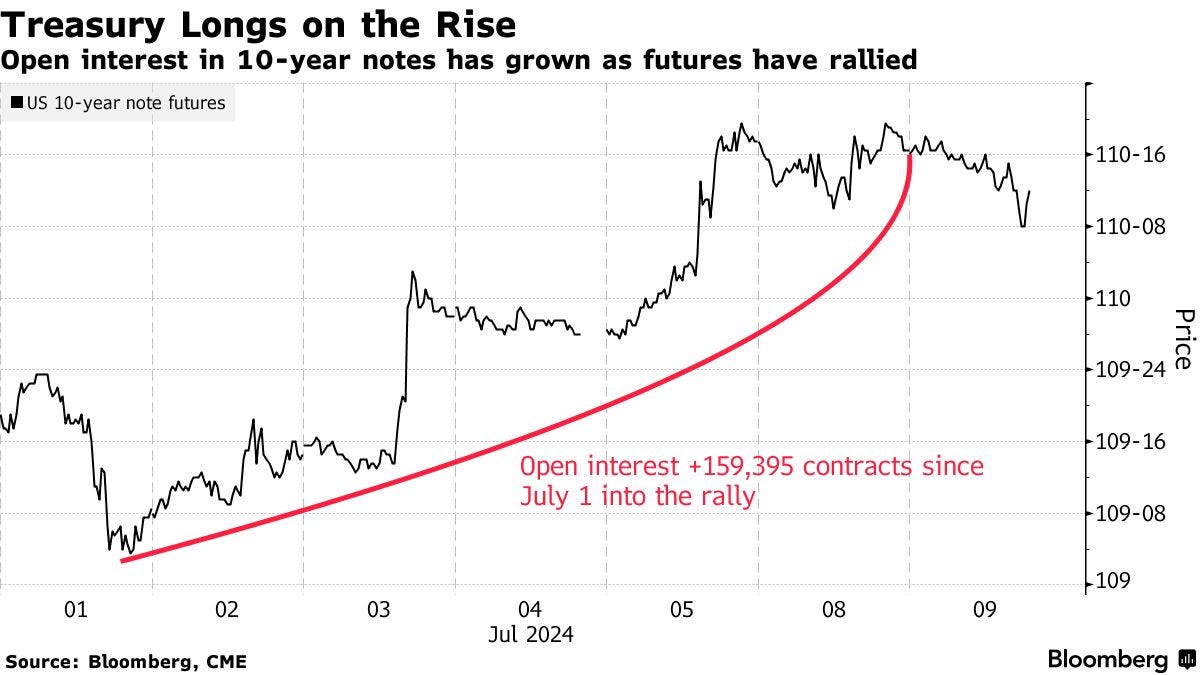
This month, bond traders built up bets on a Treasury rally every day in July. Positioning data every day since July 1 shows traders building up bullish bond wagers ahead of the Fed chair’s testimony to Congress and a reading of the consumer price index this week. Those bets stand to benefit if Powell’s remarks or the inflation data on Thursday bolster expectations for interest-rate cuts this year. Bullish sentiment is also showing up in the cash market, with a JPMorgan survey showing clients increased long wagers to the most in two weeks.
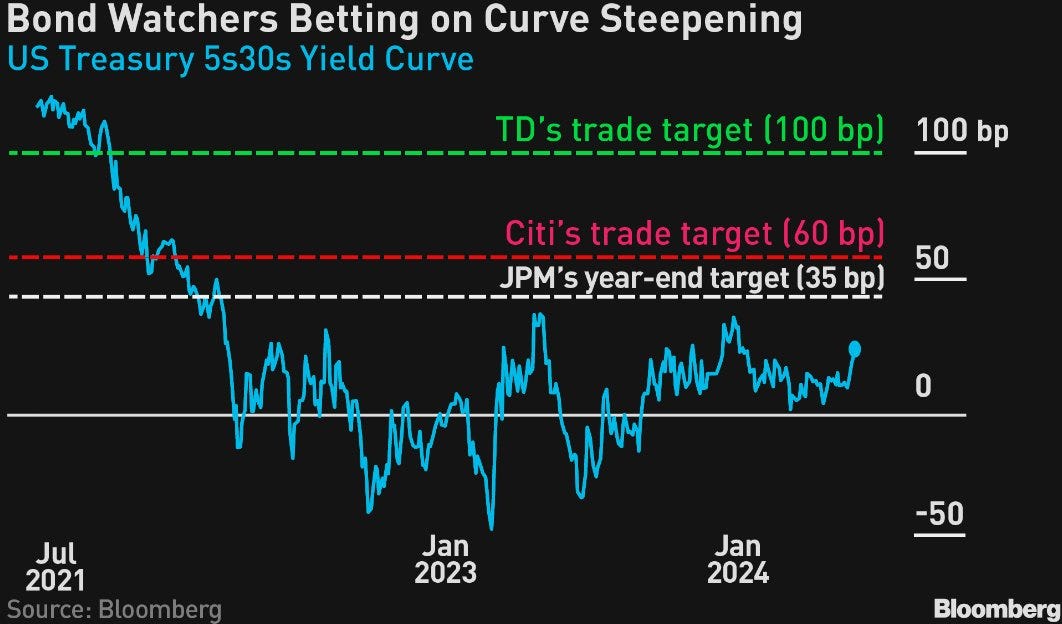
And the bond trade that some of Wall Street’s biggest banks say will dominate the rest of 2024 is gaining steam before this week’s crucial inflation reading. The bet that the US yield curve will normalize toward a steeper slope is looking as good as it has in months.
Stocks and bonds may rally in tandem, with Powell seen striking a dovish tone at Congressional testimonies this week, MLIV writes. The unemployment rate already exceeds the FOMC’s 4% year-end forecast and bonds may emerge as winners in the days ahead depending on Thursday’s CPI print.
In the week ending July 8, JPMorgan clients increased their outright long positions by 5% to the most in two weeks. Over the same period, outright shorts also increased by 2%. Outright shorts are now the highest since June 10.
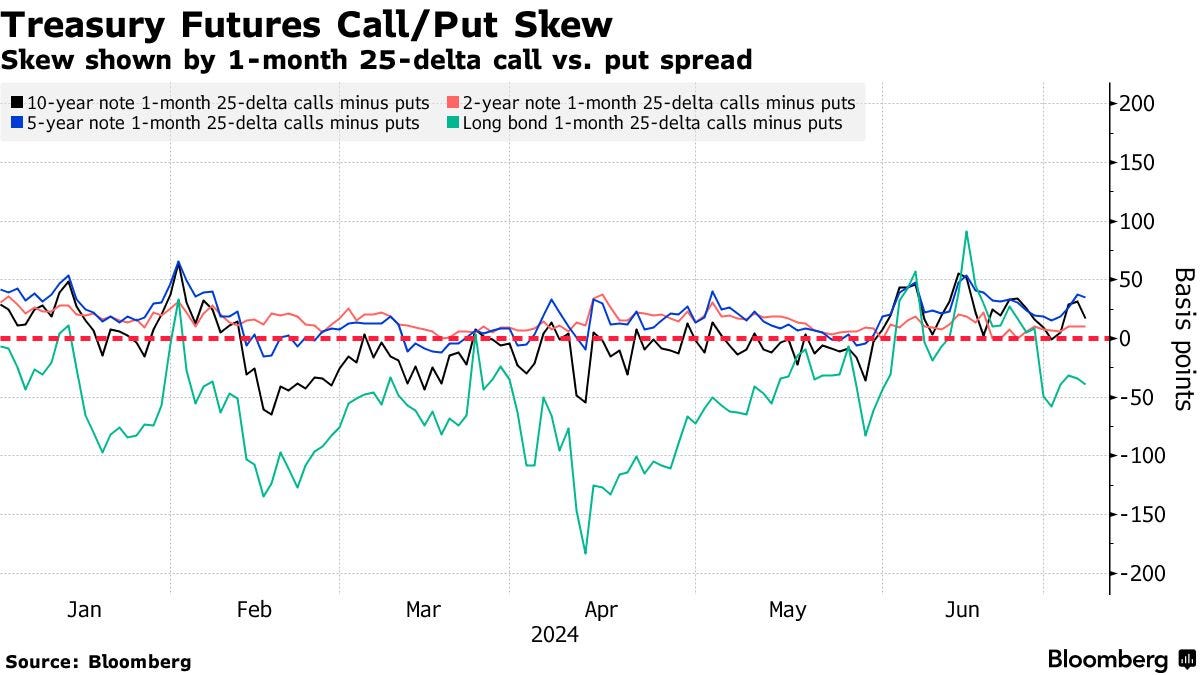
Options Premium Favors Puts in Long-End. The premium paid to hedge risk in the long end of the curve has remained skewed toward puts over calls as traders paid a higher price to hedge a selloff, rather than a rally, via bond options. The skew in the front and belly of the curve continues to slightly favour call options, indicating traders are paying a premium to hedge a rally over selloff in these tenors. Recent Treasury flows have included a bearish 10-year hedge targeting 10-year yield rise to 4.4% before July 26, along with a near-term long volatility play via 10-year weekly options.
US Economy showing signs of weakness, boosting these cuts bets
US corporate bankruptcies in June reach highest monthly level since early 2020. There have been 346 bankruptcy filings in the US, year-to-date, the most since 2010. In June alone there were 75 bankruptcies, higher than every single month during the COVID crisis.
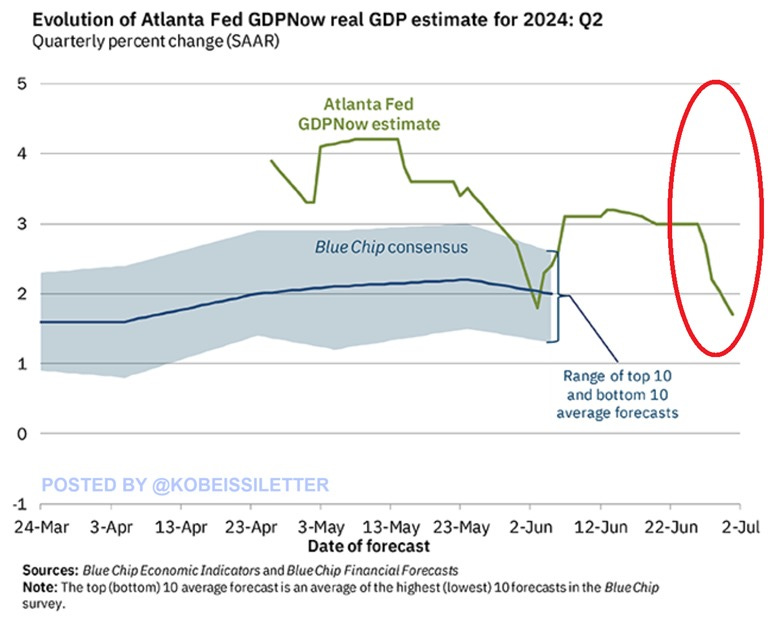
GDP growth estimates are plummeting. The most recent Atlanta Fed estimate for real US GDP quarterly growth in Q2 2024 is down to 1.7%. This estimate is down from 4.2% seen in mid-May and from 2.2% seen on June 28th. If this estimate turns out to be correct it will be the 2nd consecutive quarter of GDP growth below 2.0% after Q1 2024 GDP of 1.4%.
The US real-estate market is headed for a correction, strategist Chris Vermeulen has said, per BI. The chief market strategist of The Technical Traders pointed to worrying signals flashing in the real-estate sector, as borrowing costs look poised to stay higher for longer. "People don't realize real estate is primed and ready for another major leg down," he said. Signals in construction activity are mirroring the period leading up to the 2008 crash. Yahoo Finance
And there are elections… Morgan Stanley’s Mike Wilson says traders should brace for a significant pullback in the stock market as uncertainty swirls around the US presidential campaign, corporate earnings and Federal Reserve policy. “I think the chance of a 10% correction is highly likely sometime between now and the election,” Wilson said in an interview with Bloomberg Television Monday. But a rising number of Wall Street pros have begun to grow cautious heading into the third quarter, a seasonally turbulent period, particularly amid signs the rally is overheating. Goldman Sachs Scott Rubner said Monday that he’s modeling a painful two-week stretch starting in August if corporate earnings disappoint. Andrew Tyler at JPMorgan Chase trading desk said he’s bullish with “slightly less conviction” from recent weakening economic data. And Citigroup’s Scott Chronert has sounded the alarm on a potential pullback. Finally, a 20% correction could be coming for the S&P 500 warns Jonathan Krisnky, Chief Market Technician at BTIG. He notes the S&P 500's advance/decline line hit its highest level in early May and has been declining since. A similar situation occurred in 1998 followed by a 22% fall.
Stock market: only up, but still concentrated
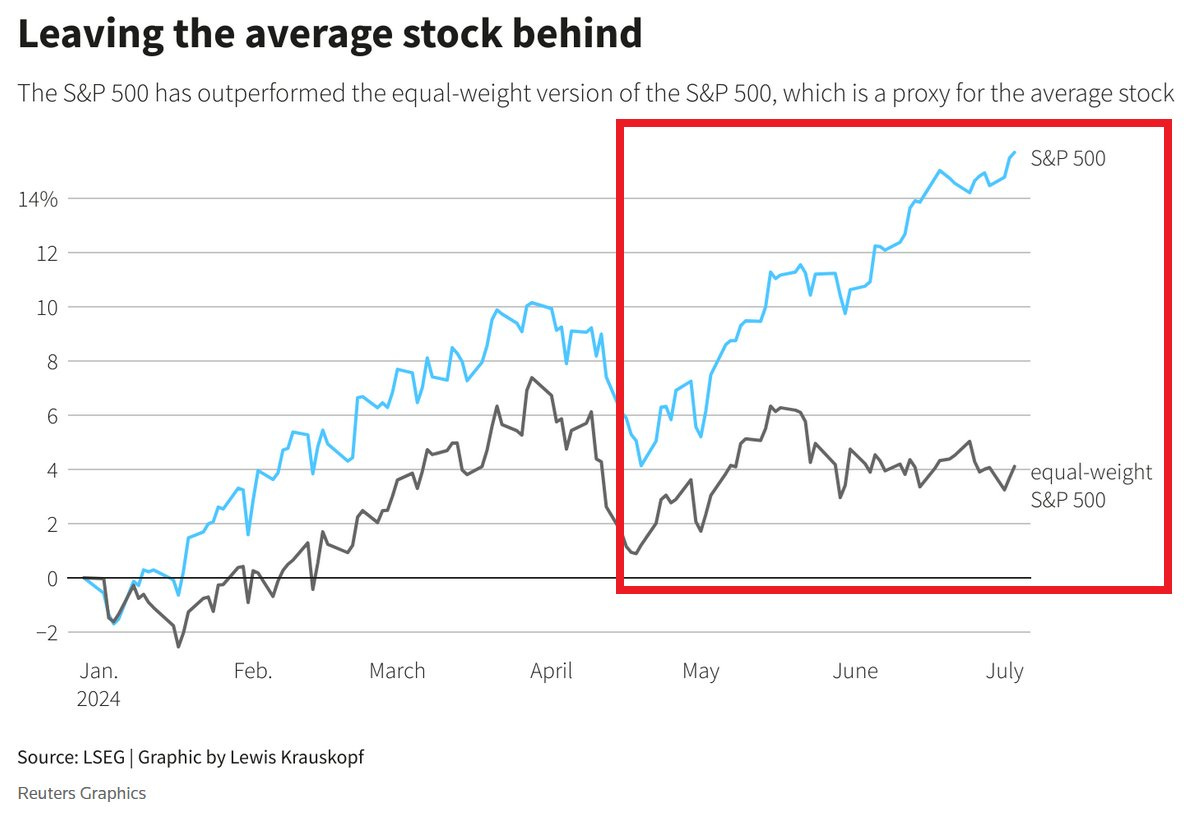
S&P 500 is up a whopping 17%, year-to-date in one of the best performances in an election year EVER. At the same time, S&P 500 Equal-Weight index, (average stock proxy) is up only 4%. Notably, 40% of S&P 500 firms are down for the year.
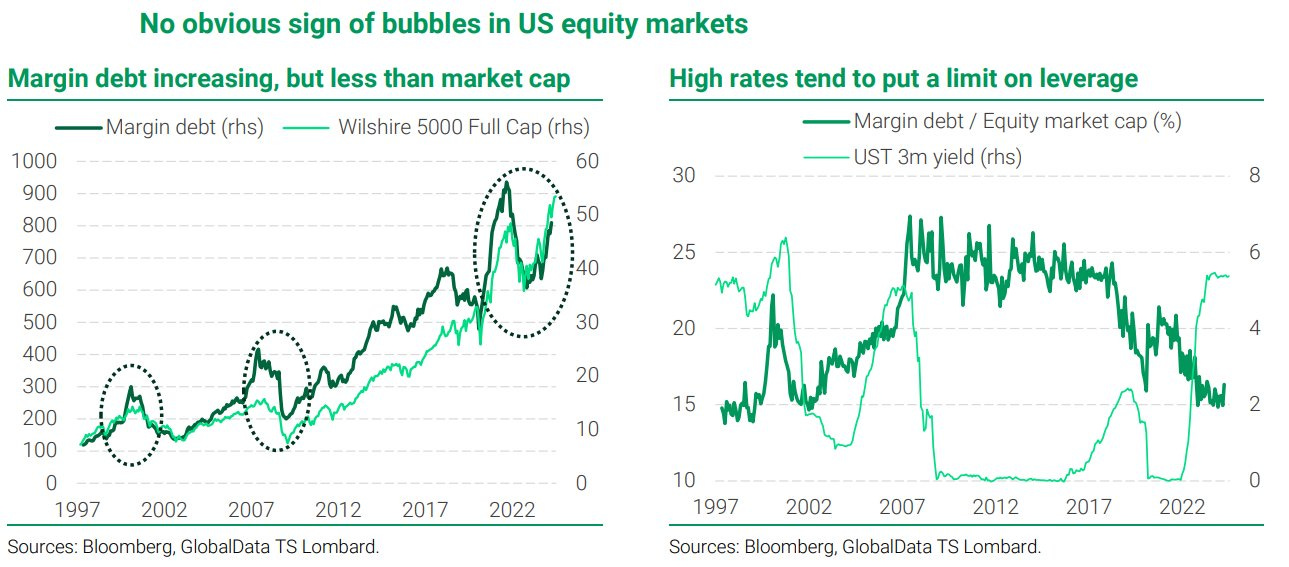
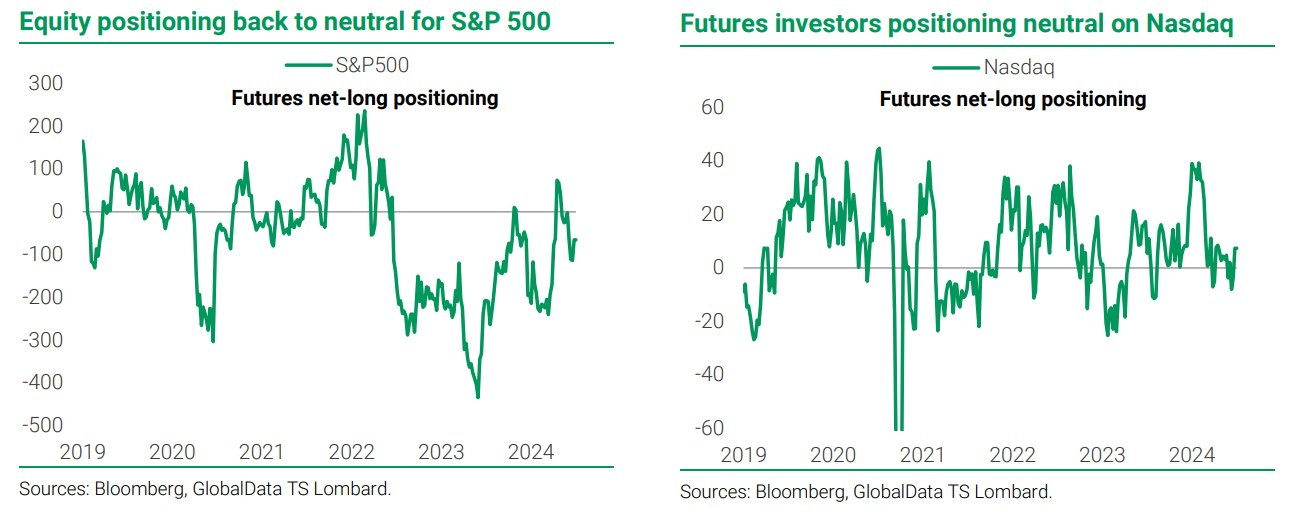
For TS Lombard, there are no obvious signs of bubbles in US equity markets. While both margin debt and futures positioning have increased in US equity markets, there are no obvious signs of a bubble so far. Unlike in previous bubble episodes (incl 20-21), margin debt is growing less than the equity market capitalization. Rather than being driver of equity performance, it is likely a consequence. This is unsurprising give high level of interest rates, which is not conducive to leverage increases. Another indication of non-bubble is investor positioning, which is close to neutral in both S&P 500 and Nasdaq futures.
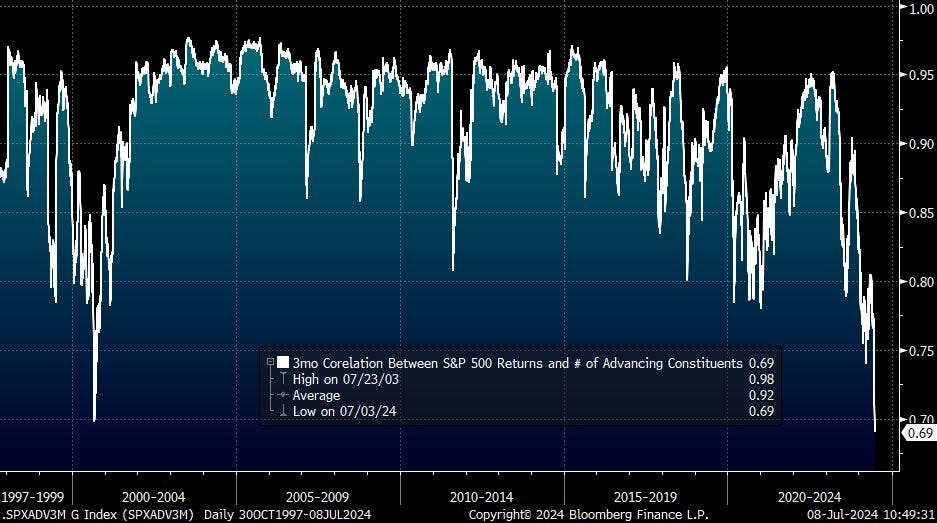
Yet, there is a concentration concern: the 3-month correlation between the S&P 500 and the number of stocks advancing has fallen below the dot-com bubble era low. This is the lowest on record: the number of stocks driving gains is the smallest EVER. Notably, 40% of S&P 500 stocks are down year-to-date.
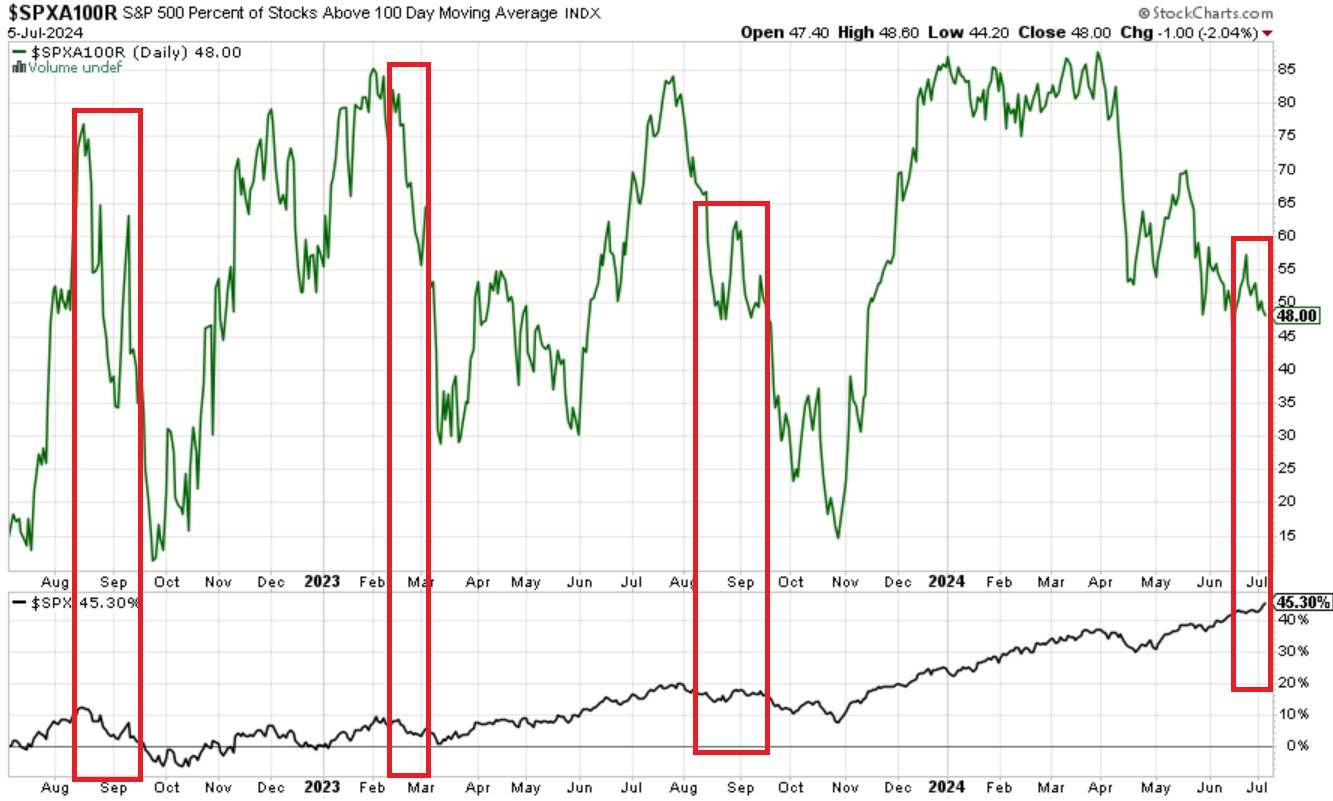
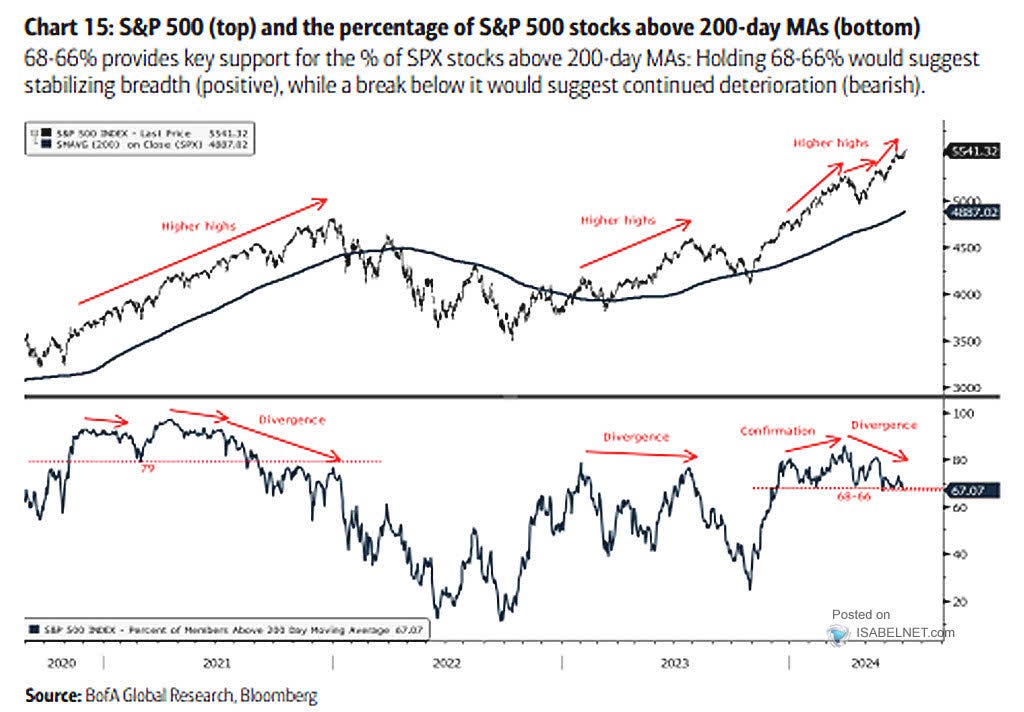
US market breadth is still very weak. 48% of S&P 500 companies trade above its 100-day moving average. This is the lowest level since November 2023. Meanwhile, the S&P 500 has hit 34 all-time highs this year and is up by 17%. At the same time, ~40% of stocks are negative for the year.
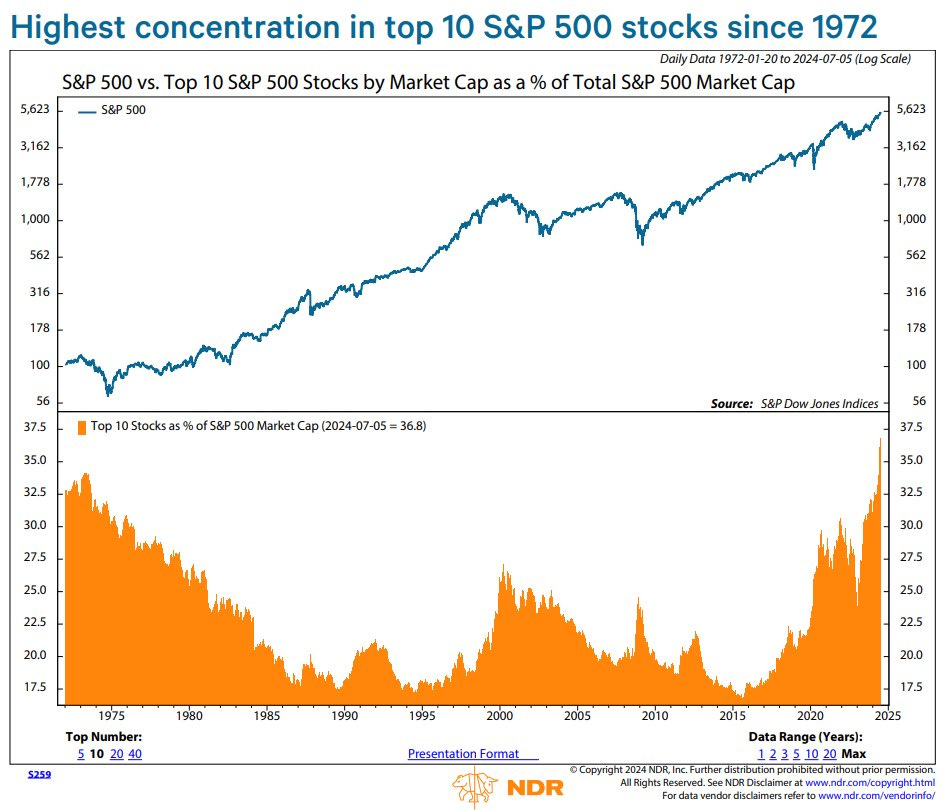
Top 5 S&P 500 now account for 29% of the index, the highest level of concentration in at least 60 years.
Top 10 S&P 500 stocks now account for ~37% of the index market capitalization. This is the highest share since at least 1972. It is certainly one of the largest concentrations in history of the stock market.
But the average magnitude of fragility events in the 50 largest stocks of the S&P this year so far is currently at its highest since 1992, highlighting the instability in single stock dynamics. Average magnitude of fragility even. (when sigma move magnitude> 3) for the largest 50 stocks in S&P 500.
S&P 500: the percentage of S&P 500 stocks above their 200-day moving average is showing signs of a bearish divergence, which can be an early warning signal of a potential market correction.
In fact, small cap tell a different story…
Small cap stocks are down 2% on the year while Large caps are up 18%. This is the biggest outperformance of large over small since 1998.
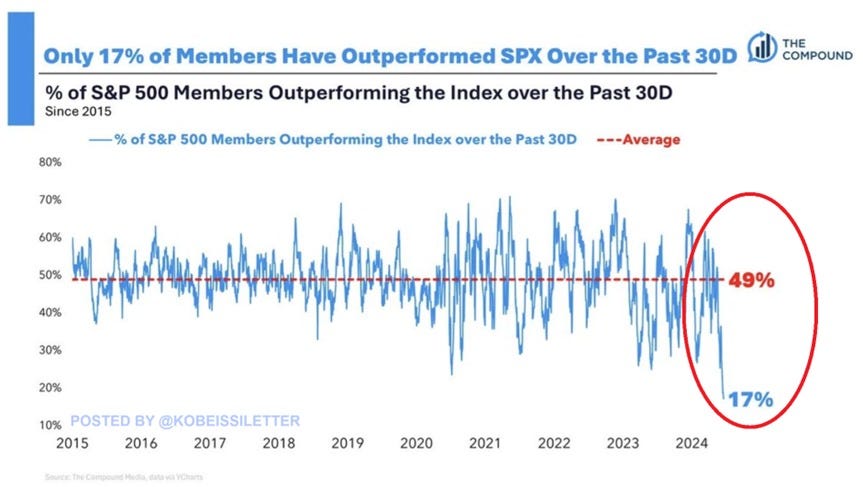
The Kobeissi Letter points out that only 17% of S&P 500 names have outperformed the index in the past 30 days, the lowest share in at least a decade.
Russell 2000 index of US small capitalization stocks has recorded 667 days without reaching a new all-time high. This is the longest streak since the Great Financial Crisis and the 3rd longest in over 40 years.
These factors drove Piper Sandler, a prominent Wall Street firm, taking the surprising decision to discontinue providing S&P 500 price targets, citing that the index "no longer makes sense" as a benchmark. This move, announced by the firm's chief investment strategist Michael Kantrowitz, reflects growing concerns about the effectiveness of market-wide targets in today's investment landscape. Kantrowitz argues that the S&P 500's performance has become increasingly dominated by a small number of large stocks, making it less representative of the broader market. This decision highlights a shift in how some financial institutions are approaching market analysis and communication with clients, emphasizing the need for more nuanced and targeted investment insights.
Taking a look at RSP, an ETF that replicates the S&P but equal weighted, Piper Sandler thesis has a point:
This ETF, in 2024, has a 2.03% performance, while SPY gained 16.82%. The gap between SPY and RSP is currently around 1,300bps, which would be the second-largest performance differential for the ETFs since RSP’s inception in 2003 (in 2009, RSP soared almost 45%, trouncing the 26% gain for SPY). SPY hardly represents the market effectively, as it is skewed towards a few large-cap stocks, leading to inflated valuations and increased risk.

