


Tech tumble: Nasdaq's biggest drop since 2022
From Magnificent 7 to Maleficent: US$ 2tn wiped out in 10 days

A big fall, but a rebound could be in the cards
Yesterday, US stocks tumbled in the worst sell-off for the S&P and Nasdaq in 2024. Scary statistics were plentiful given today’s pullback as the S&P 500 slides over 2% for its worst day since February 2023 and turned negative on the month with pullback; the VIX new highs up over 22% above 18.40 (took out last week high 17.19) and highest since 18.72 on 4/22. The NASDAQ 100 fell over -3.5% in biggest decline since October 2022. The Dow falls over 1% to move back below 40,000. Just relentless selling pressure from overnight, to the open, and throughout the trading day with tech bashed the most.
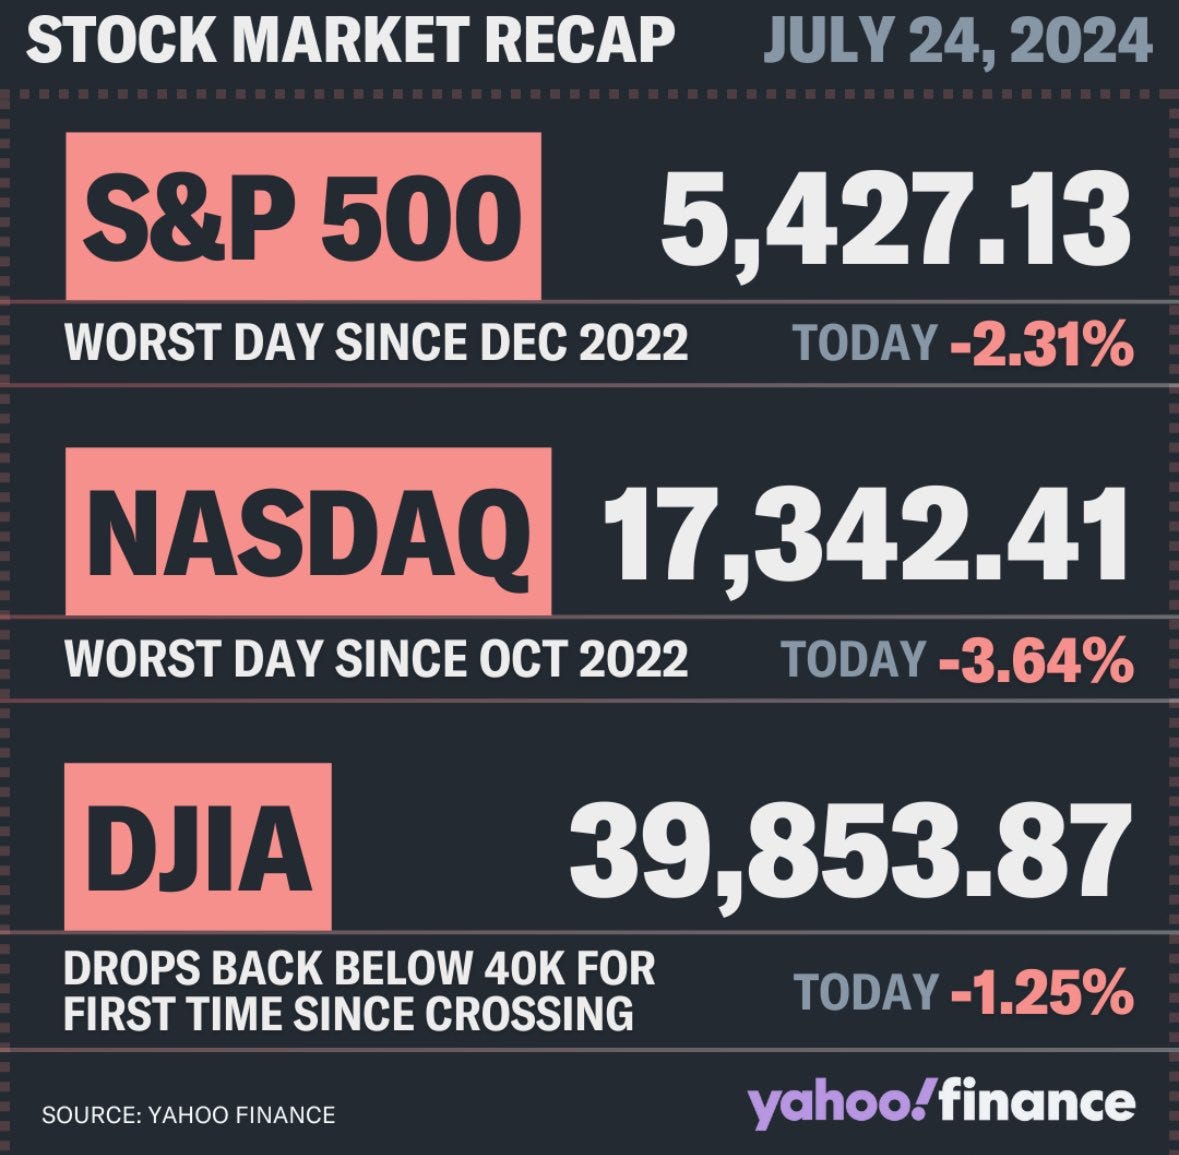
The S&P 500 has officially closes the day 2.3% lower, ending its longest streak without a 2%+ decline since 2007. The S&P 500 erased over US$ 1tn of market cap yesterday.

The NASDAQ 100 had its worst 10-day drop since December 2022, falling 3%. Now trades below 50-day moving average for first time since early May.

The Magnificent 7 dropped by more than US$ 750bn and has lost almost US$ 2tn in market cap in the past 10 days. Amazon, Apple, Google, Meta, Microsoft, NVIDIA, and Tesla combined saw largest daily loss since Oct 2022.

US Small Caps are up 7% over the last 10 trading days while US Large Caps are down 4%. The 11% spread is the largest 10-day Small Cap outperformance ever.

Goldman Sachs said US small cap rotation has been triggered by macro, boosted by positioning.

On the other hand, Morgan Stanley thinks small small caps won’t last. Mike Wilson sees limited fundamental justification for small cap outperformance continuing in a durable manner, especially as inflation (ie. pricing power) comes down. The cohort has historically underperformed following outsized, tactical rallies, and its relative performance versus large caps is now facing technical resistance. For those looking to the 2016 playbook, Mike points out that relative earnings revisions for small cap cyclicals are much weaker today than they were during that period. For now, within small caps, Mike believes growth equities offer the better risk-reward. Their valuation should benefit as the Fed cuts, yet at the same time, their revenue streams are less adversely exposed to the reason why the Fed is able to cut – falling pricing power.
Downside risk now, but a rebound is not excluded. Yesterday was a material single day decline. The S&P 500 is below its short term trend, a checkmark on the risk-off criteria. Despite the daily decline, breadth remained positive with more stocks making new highs than lows, and this is very unusual.
Goldman Sachs says the recent slump in US stocks is flashing a signal to trend-following funds: sell US equities no matter which direction the market goes. CTAs will dump stocks over the next week in EVERY SINGLE SCENARIO. If the market trades lower, CTAs are projected to sell more than US$ 7bn worth of equities.

CBOE Volatility Index (VIX) soars to highest level in more than 3 months, above 18%.

We believe that the most probable scenario in the short term is a market rebound, but the next rally is also expected to be sold. Now we are seeing resistance levels gaining strength.
And the economy is showing cracks…
Fed to cut sooner? The US yield curve steepened sharply amid growing calls for the Federal Reserve to start cutting interest rates as soon as next week. Investors see the Fed potentially reducing rates faster and deeper than previously anticipated. Swaps traders still price in more than two quarter-point cuts this year, with the first move likely in September. But with the central bank scheduled to announce its next decision in a week, pressure is rising for lower borrowing costs.
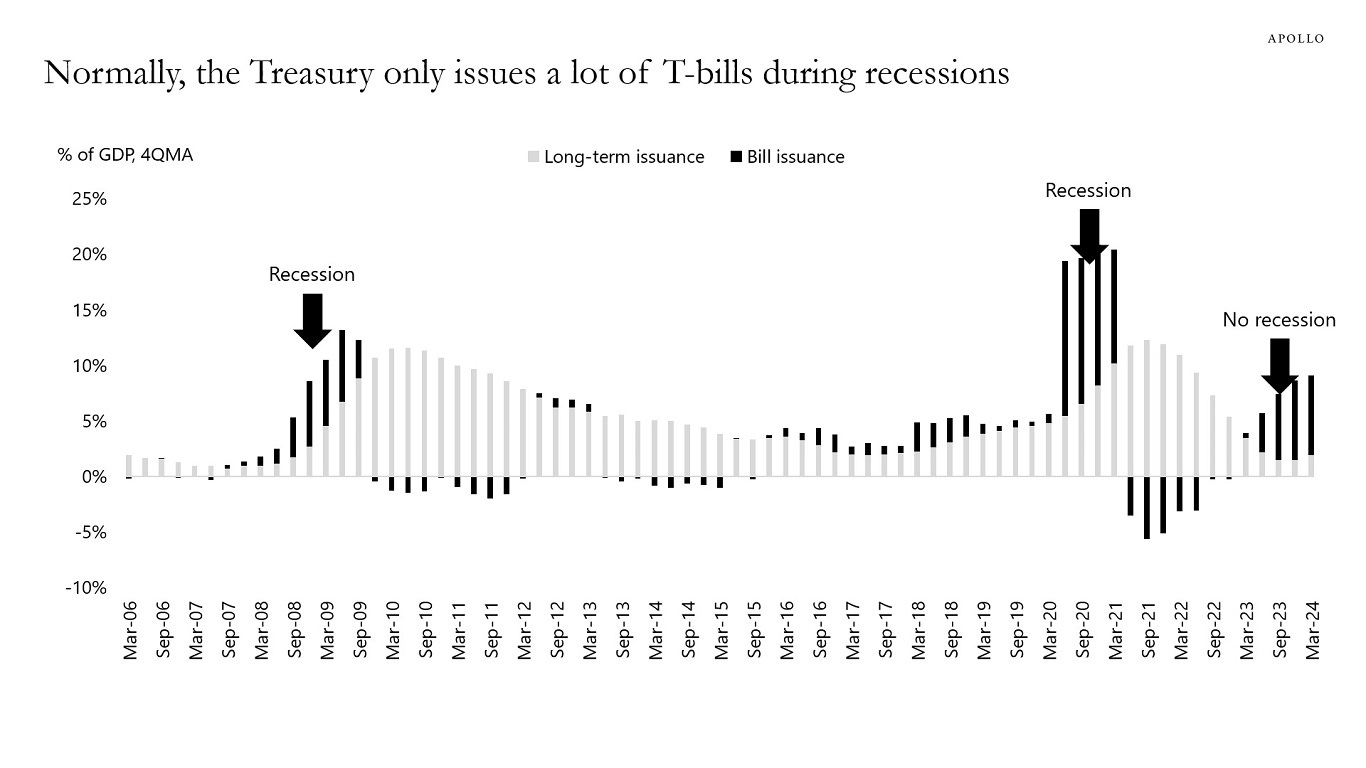
Apollo: Steeper curve coming? During recessions, Treasury issuance shifts to T-bills, partly because during recessions, short rates are low and T-bills are a cheap source of financing. So why is T-bill issuance so high today when the fed funds rate is high and the yield curve is inverted? And what will issuance look like if the economy is slowing down and we enter a recession later this year? If the Fed starts cutting in September and issuance shifts to coupons, it will likely lead to a steeper curve.
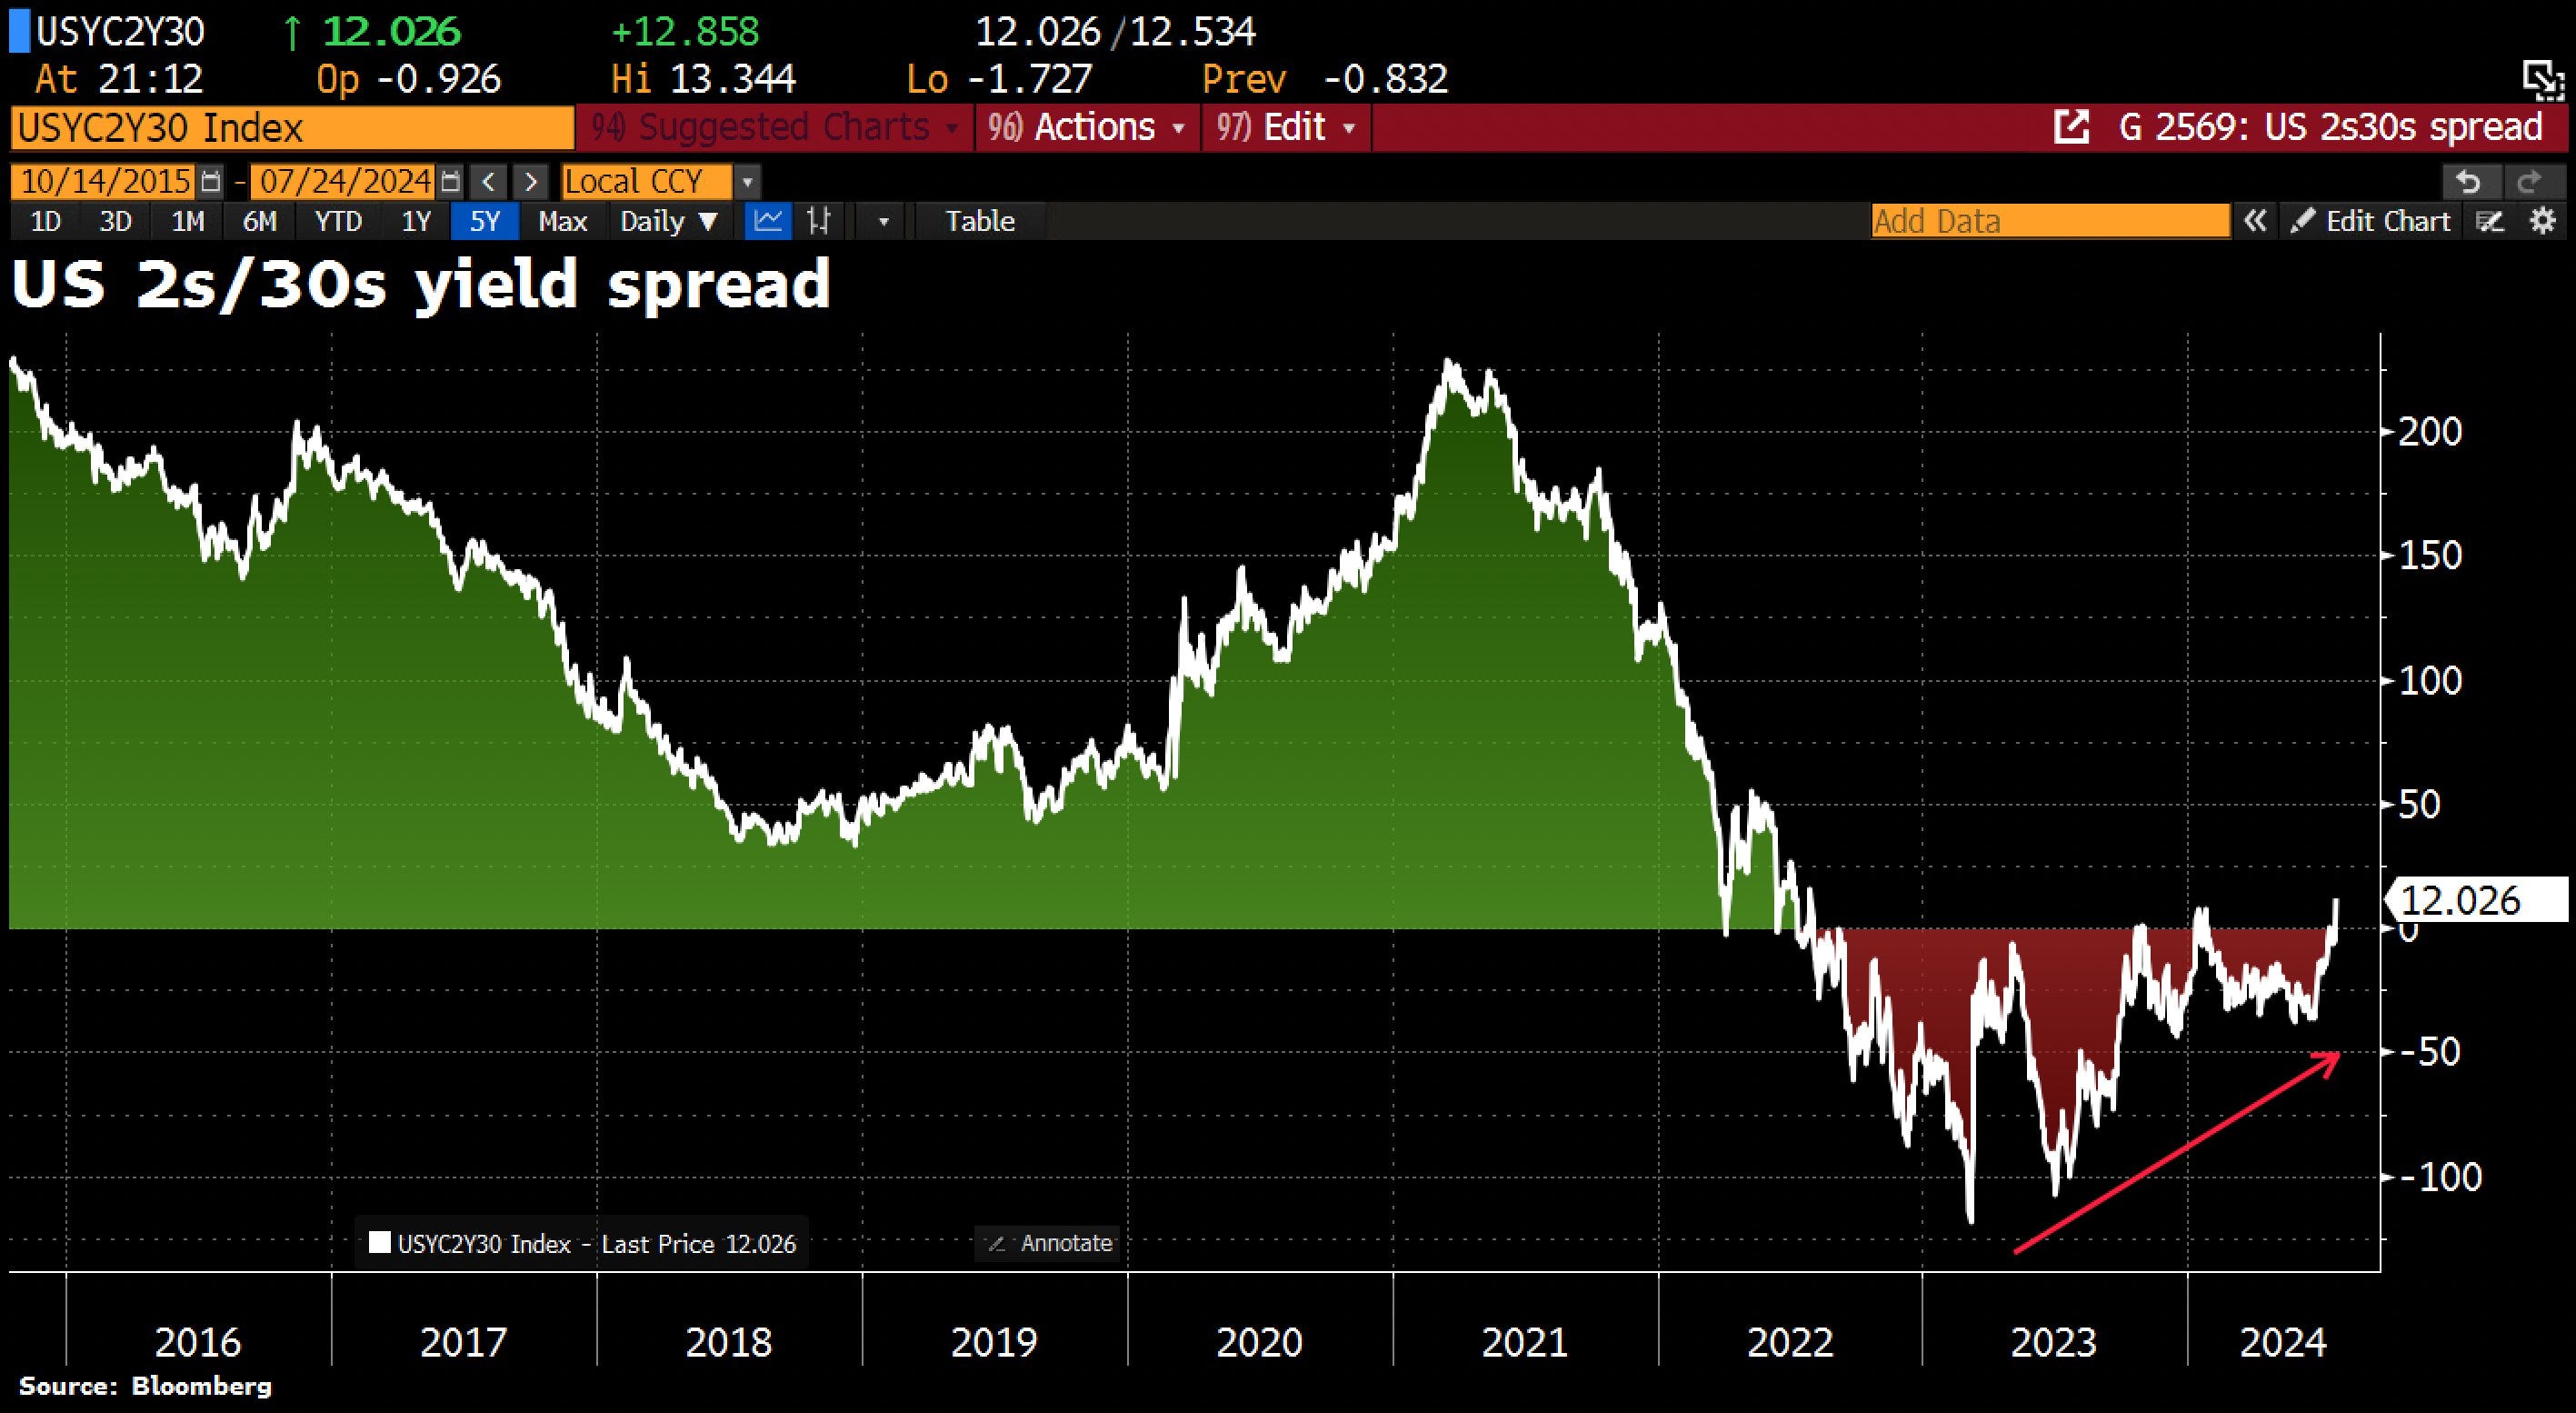
In the context, unsurprisingly, the US yields steepening trade continues with US 2s/30s yield spread jumps to 12bps, the highest since 2022. It’s a sign investors see the Fed potentially cutting rates faster and deeper than previously anticipated, starting as soon as next week.
Also the 2s/10s Treasury yields spread is disinverting, pushing their differential to the smallest margin since October 2023.

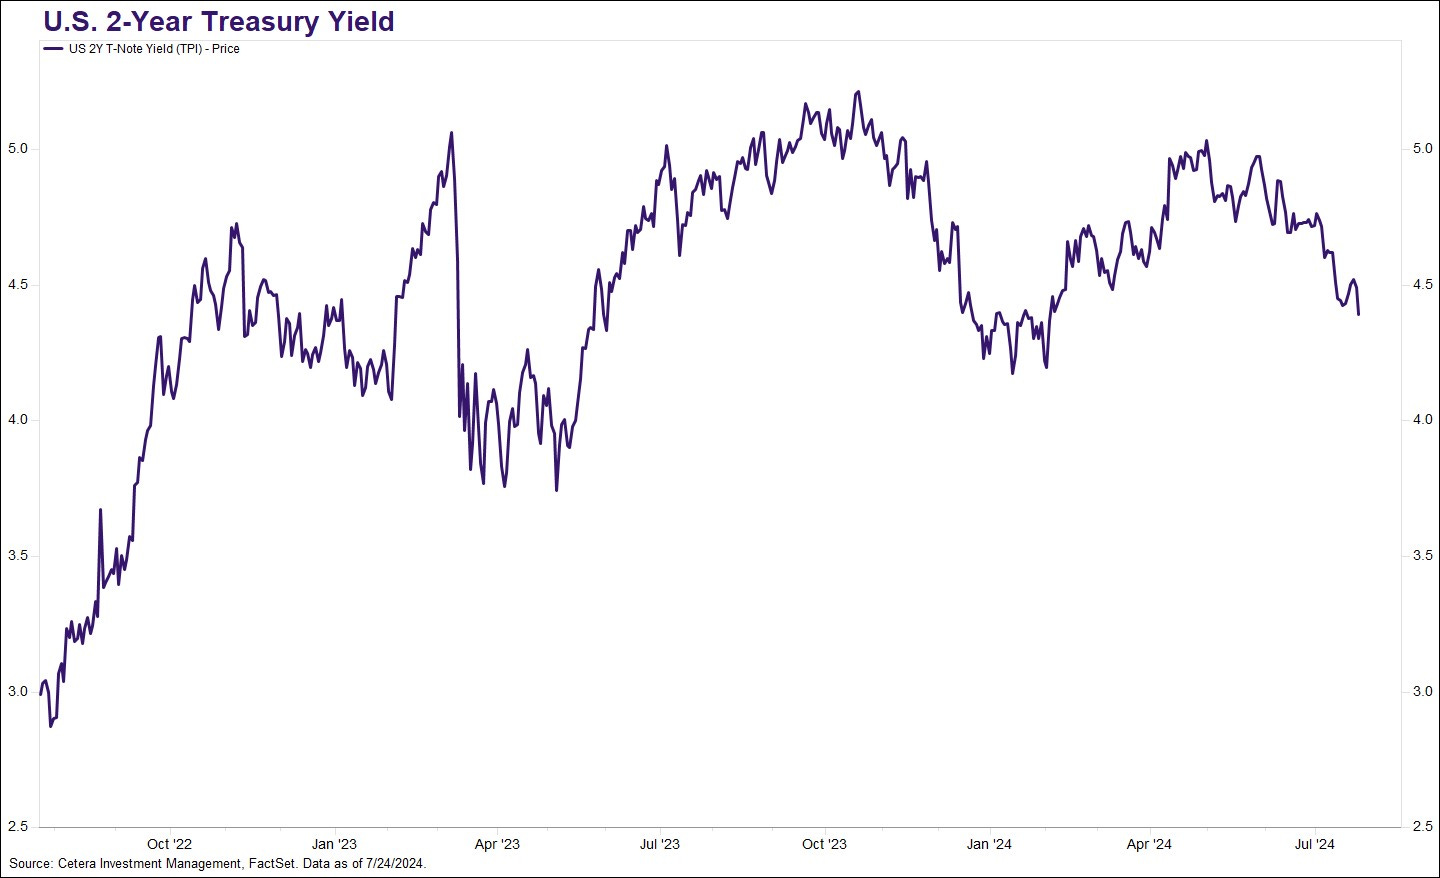
Bond yields continue to trend lower as rate cut expectations increase. The 2-year Treasury yield fell below 4.40% for the first time since early February, implying that markets expect the Fed funds rate to be 100bps lower in a year.
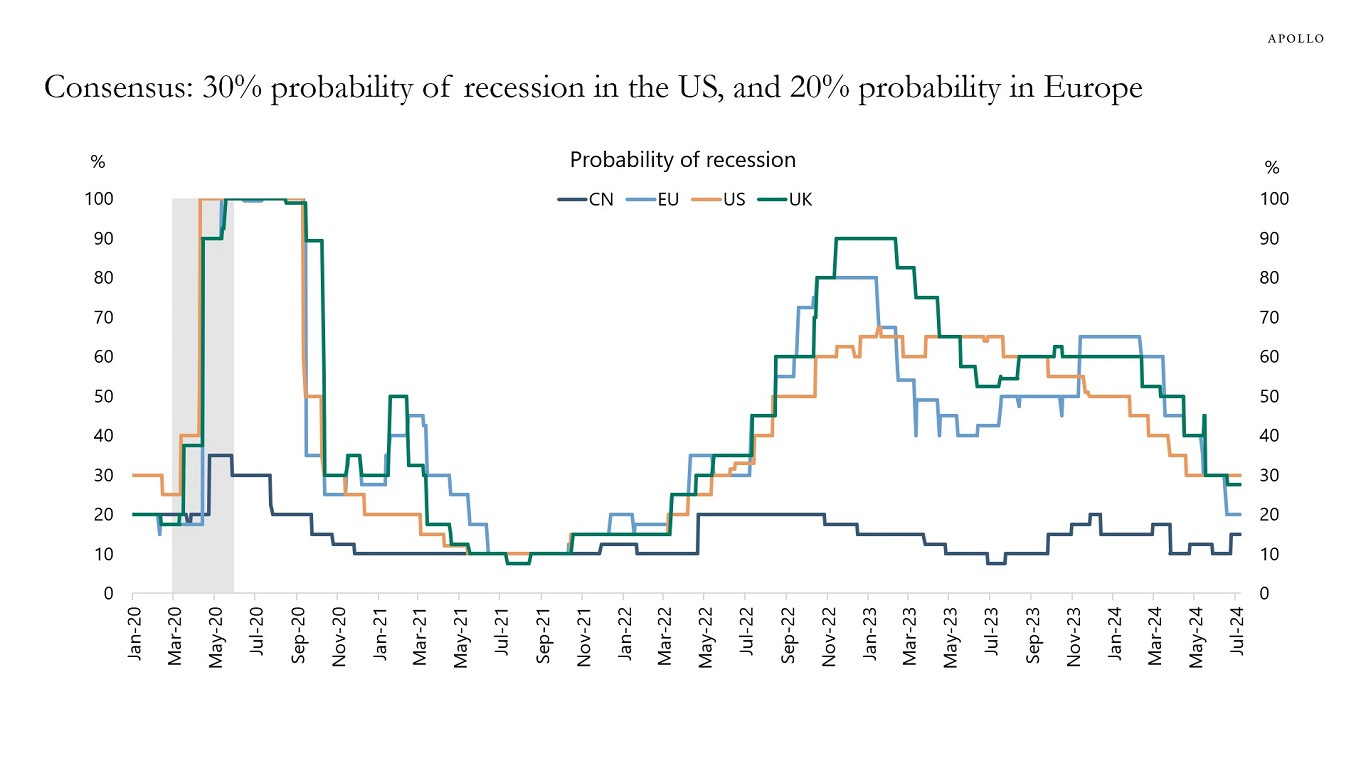
Apollo: Why would Long and Variable lags be asymmetric? Let’s assume that the economy is finally slowing down. If it took the Fed two years to slow the economy down, then once the Fed starts cutting rates, it will take two years for the economy to reaccelerate. As a result, cutting rates in September will not be enough to prevent a recession. In other words, with the consensus expecting a soft landing, the key question in markets today is why the transmission mechanism of monetary policy should be asymmetric when the Fed is cutting rates versus raising rates. If the long and variable lags are symmetric, it should take two years before the economy accelerates from when the Fed starts cutting in September 2024. The consensus sees a 30% probability of a recession within the next 12 months. The consensus likely thinks that the lagged effects of Fed hikes will eventually slow down the economy.
High Yields: Goldman Sachs has a positive outlook for the high-yield bond market over the next 12 months, anticipating that high-yield spreads will tighten, driven by robust economic conditions and optimistic investor sentiment.
